Web analytics
Let’s start by looking at the concept of web analytics. What exactly does it mean?
Well,web analytics involves the collection, measurement, and analysis of website data. Web analytics tools can provide lots of useful information about the origin of website traffic, how website users navigate and interact throughout a website, what content and web pages they’re most engaged with, and how they exit the site.
Why use analytics?
There are many reasons why using analytics tools is a no-brainer for digital marketers today. Here are three of the more important reasons:
Helps you take data-led decisions
Marketers can use the data uncovered by analytics tools to optimize the performance of their channels and websites by taking data-led decisions. These are actions we take to improve performance based on our understanding of the data we’ve recorded; that is, the data is leading the decision. This is a very effective way to use rational thought to improve performance. While it’s best practice to follow data-led decisions, we must always remind ourselves to ‘trust but verify’.
Makes reporting easier
Apart from helping with decision making, web analytics is an important information source to help marketers report back to key stakeholders on how campaigns and websites are performing in relation to your digital marketing efforts. Ultimately, marketers are trying to recreate scenarios that lead to commercial outcomes for their organizations or clients. You can do this by measuring and acting on the data trends you observe using web analytics software.
Helps you deduce the ‘story’ behind the data
One of the real values of web data analysis is that it allows you to deduce the ‘story’ behind the data in order to gain valuable insights and enhance business performance. But how exactly does this lead to commercial returns? Well, web analytics can help you understand your customers better. It tells you who they are, where they’re coming from, and what their interests are. It tells you about their demographics and location. It also helps reveal any conversion challenges that might exist on your website. It helps you appreciate what consumers like or don’t like, and how they interact on your website. You can use all this information to improve the experience on your site for the consumer and to optimize the channels that consumers use to visit your website.
Analytics tools
There are numerous analytics tools available on the market today. Some of them are free, some of them require a paid subscription. Paid analytics products and free analytics products will differ in terms of support, features, and functionality.
Some examples of analytics packages that are available include:
- Google Analytics and Google Analytics 360, which are part of the Google Marketing Platform
- Adobe Analytics
- Woopra
- Kissmetrics
- Webtrends
- Piwik
Google Analytics (GA)
The market leader and most commonly used analytics program is the free version of Google Analytics, or GA as it is sometimes known. The paid version of GA, called Google Analytics 360, offers some additional functionality in terms of report validity and sample sizes. But it’s mainly for websites that receive over 10 million page views per month. For the vast majority of websites, the free version of Google Analytics is perfectly fine.
Because of its functionality and widespread adoption in the market, Google Analytics is seen by many marketers as the single source of truth for website traffic, engagement, and conversion data.
Google Analytics can track the user or consumer journey, providing rich data around channels used, locations, and devices. These journeys can then be tracked through to on-site activity, goals achieved, and exit point, as well as returning visitors, which indicates loyalty.
Benefits of Google Analytics
Google Analytics is an excellent choice for most marketing needs. Some benefits of the standard, free version of Google Analytics include:
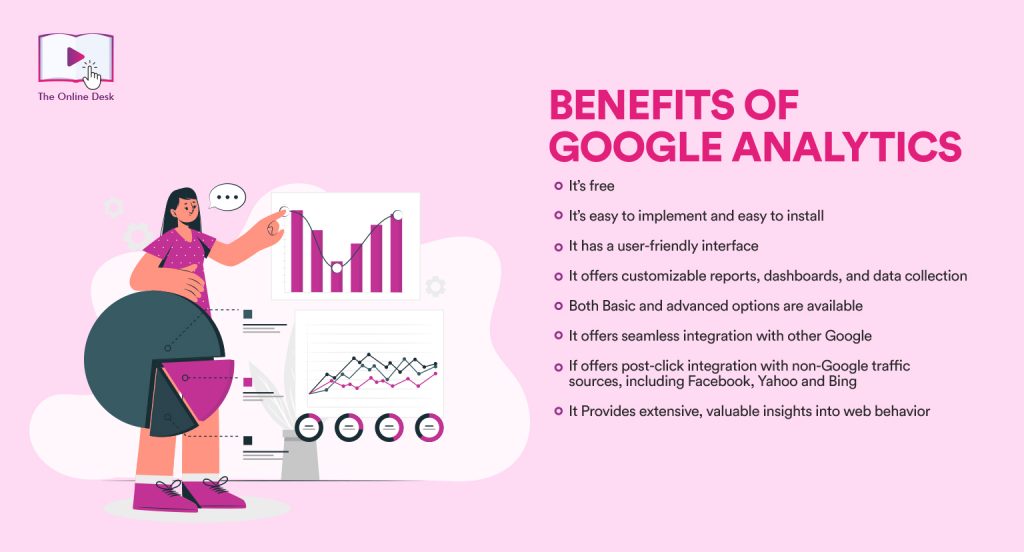
- It’s free
- It’s easy to implement and easy to install
- It has a user-friendly interface
- It offers customizable reports, dashboards, and data collection
- Both basic and advanced options are available
- It offers seamless integration with other Google products
- It offers post-click integration with non-Google traffic sources, including Facebook, Yahoo, and Bing
- It provides extensive, valuable insights into web behavior
Limitations of Google Analytics
However, Google Analytics does have a number of limitations:
- It doesn’t provide real-time data in downloadable historical reports
- The free version is limited to 10 million hits per month
- It offers limited customization
- It defaults to last-click attribution
- It’s not always 100% accurate
- It’s not as comprehensive at measuring the performance of top-of-funnel campaign activities like display and Facebook, where there is limited user visit and conversion data from these campaigns
However, despite these limitations, Google Analytics is still a highly effective web analytics tool for marketers in most instances.
Understanding the basic terminology
There are two key concepts underpinning analytics reporting – dimensions and metrics.
Dimensions describe data. They are things like country, channel, location, age, gender, and device used. Metrics measure data. Metrics might include visitor numbers, revenue, goal completions, and so on.
We segment metrics using dimensions – for example, visits by device type – to get a complete picture. So we can see the total visitor metrics for a website segmented by the device category dimension – that is, desktop, tablet, or mobile users. This allows us to better understand the effectiveness and scale of each device in driving visits and conversions on a website.
Some common dimensions within Google Analytics include:
- Channel Name
- Month
- Country
- Device
Some common engagement metrics within Google Analytics include:
- Sessions
- Users
- Percentage New Sessions
- Page Views
- Pages per Session
- Average Session Duration
You should explore the metrics that are available to you, and see how they can be segmented using dimensions to get a deeper understanding of your website traffic and customers.
What are conversion metrics?
Conversion metrics are an extension of standard visitor metrics. They focus on telling the story behind the valuable actions that users can take on your website. These are generally actions that impact commercial performance, such as revenue totals, conversion rates, and so on.
There are a number of common conversion metrics within Google Analytics. They can all be viewed in the Traffic reports, so you can see how much value each of the different channels is driving. Common conversion metrics include:
- Goals – the number of valuable actions taken on the site, including sales, leads, or downloads
- Conversion Rate – the percentage of visitors that complete a goal
- Transactions – the number of individual sales or shopping basket items sold on an ecommerce website
- Revenue – the monetary value of the ecommerce sales
You can start to determine the value of the campaigns from your different digital marketing channels by looking at the number of goals and transactions from each channel, the conversion rates, and the cost per conversion. With these three data points, you can decide if a channel is profitable in relation to its time and cost investment.
Using Google Analytics
Now that we’ve covered the background of web analytics tools and why they are useful for marketers and website analytics professionals, you’re now ready to start using Google Analytics.


